A Path to More Realistic Project Completion Dates
Traditional versus Risk-Adjusted CPM Schedules

Introduction
Various industry studies reveal a widespread and longstanding problem with meeting schedules and contractual completion dates on construction projects.1 Their findings show that only a small portion of projects met, or came close to meeting their original schedules.2
This still holds true today, as evidenced by a 2021 global construction survey:
In the 20 years that we’ve been surveying project owners and engineering and construction companies’ performance, we’ve never lost sight of their core objectives: to deliver high-quality projects on schedule and on budget. […] However, increasing project complexity, plus the pressure to build bigger, faster and more cost-effectively, has outpaced the ability to control risks, costs and schedules, resulting in continued failures—sometimes, regrettably, on an epic scale.3
These studies, supported by Revay’s own experience, suggest that there may be numerous underlying issues preventing projects from being completed on time, most notably the reasonableness of the method upon which the schedule and associated contractual completion dates are established. In some cases, there may be an opportunity to improve the way that construction schedules are developed, and ultimately how contractual project completion dates are established.
Historically, construction schedules have been developed using simple scheduling methods, based on discrete activity durations and logic, and which use the longest uninterrupted path flowing through a schedule (the critical path) to determine the earliest project completion date.
These traditional critical path method (“CPM”) schedules, commonly known as “deterministic schedules,” are still widely used in the construction industry by both owners (to establish contractual completion dates at the conceptual or tender stage) and contractors (as a tool to manage their projects). In fact, most construction schedules today are traditional CPM schedules, with a fixed total duration.
Such schedules are only accurate if each activity starts on time and takes exactly as long as its planned duration. Furthermore, traditional CPM schedules do not account for uncertainties, and thus offer no deeper insight on the impact of possible variations4 in durations and logic on the critical path of the schedule and ultimately on the project completion date. On large and complex projects, understanding these aspects is essential.
We therefore propose that industry stakeholders consider a broader perspective on scheduling. Contractors and owners alike can benefit from schedules that provide a thoughtful appreciation of how inherent risks could impact the project. Such schedules could help parties establish more realistic contractual completion dates, which could go a long way in reducing conflict arising from claims for delays.
Risk-Adjusted CPM Schedules
An alternative to traditional CPM scheduling is to perform a Schedule Risk Analysis (“SRA”), which is a scheduling methodology that models a range of uncertainties for activity durations and other risk-driving factors. Such risk-adjusted schedules, commonly known as “probabilistic schedules,” can give additional insight to scheduling practitioners and project sponsors on the impact that variable activity durations or alternate critical paths could have on the project completion date, notably through the use of different metrics such as the Criticality Index, Duration Sensitivity Index and Cruciality Index.5 Risk-adjusted CPM schedules allow parties to establish a more probable completion date, and to identify activities that have the potential to disrupt the schedule, such that they can be closely monitored.
Risk-adjusted CPM schedules are not a new concept. The technology required to develop risk-adjusted CPM schedules has long been available and these types of schedules have long been employed by industry sectors such as mining and oil and gas. That said, their use is not widespread across all sectors of the construction industry.
Preparing Risk-Adjusted CPM Schedules
Risk-adjusted CPM schedules are developed by performing multiple simulation runs (generally more than 2,000). During each simulation, the scheduling software randomly picks activity durations from a range of variables. These variables are based on the probability distribution profile – pessimistic (maximum) duration, most-likely duration, and optimistic (minimum) duration.
During each simulation, activity start and finish dates,6 as well as the overall project duration and completion date, are calculated.7
Upon completion of the simulation runs, the results (i.e.: overall project duration and/or project completion date) are presented as a histogram and S-curve with a range of probable different project durations or completion dates, with each of these values having been assigned a probability for its occurrence.
Case Study
In order to better compare traditional CPM schedules and risk-adjusted CPM schedules, a simple example involving the construction of a school is presented below. We note that other than activity duration variability, this example does not address the many other inherent risks and uncertainties common on large and complex projects (weather-related risk, differing site conditions, design implementation, securing permits and licenses, complex activity relationships, etc.). That said, all of these could be modeled using risk-adjusted CPM schedules.
Developing the Traditional and Risk-Adjusted CPM Schedules
A traditional CPM schedule was developed with the following parameters:
- The schedule was comprised of 117 activities.
- The start and completion dates of the schedule were January 17, 2022 and October 4, 2023.
- The project duration was calculated as 626 calendar days.
- 39 activities (33% of all activities) were on the critical path.
This traditional CPM schedule was then exported to a scheduling software and simulations were performed to develop a risk-adjusted CPM schedule. The activity durations were modeled based on a minimum (-5%), maximum (+10%) and most likely duration. The results were presented as a histogram and S-curve for both the project duration and completion date. The histogram and S-curve for the project duration in this example are shown in Figure 1.
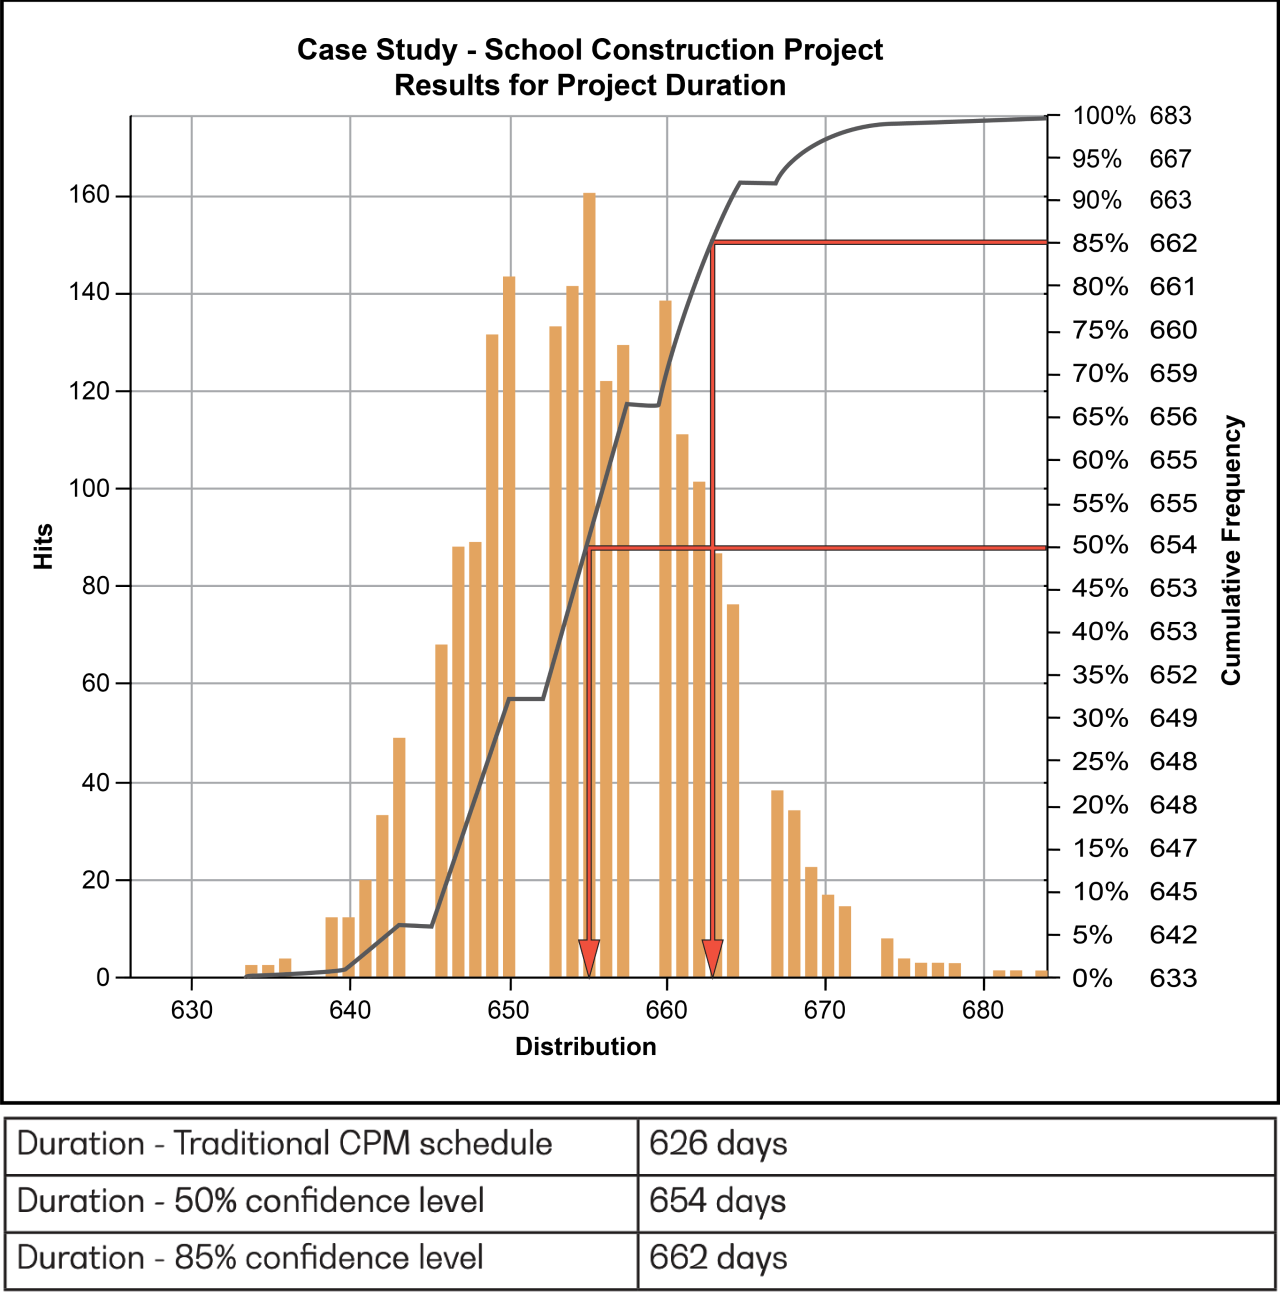
Figure 1 – Histogram and S-Curve for probable ranges of project duration
Comparison of Case Study Schedules
As shown in Figure 1, according to the risk-adjusted CPM schedule, the probability of achieving the project duration of 626 calendar days determined by the traditional CPM schedule is less than 1%.
Figure 1 also indicates that according to the risk-adjusted CPM schedule, the project duration would be 654 calendar days based on a 50% confidence level (50% of the S-curve value). This represents an additional 28 calendar days over and above the duration determined by the traditional CPM schedule.
An owner or contractor’s project management team may aim for at least an 85% confidence level of achieving the project schedule. In this example, an 85% confidence level represents a project duration of 662 calendar days, or an additional 36 calendar days over and above the duration determined by the traditional CPM schedule.
While the above discussion on ranges of project durations may seem theoretical, it is important to keep in mind that the same concepts also apply to project completion dates.
Rethinking the Contractual Completion Date
Risk-adjusted CPM schedules can assist parties in understanding the likelihood of the project’s schedule targets being met (or not), the magnitude of schedule risk being carried and the overall degree of variability and uncertainty on the project.
Such information is invaluable for both owners and contractors. While traditional CPM schedules may be sufficient for simple and small to mid-sized projects, risk-adjusted CPM schedules can be particularly beneficial for projects of a larger size and complexity. These risk-adjusted CPM schedules can provide an opportunity to revisit how we think about contractual completion dates.
Figure 2 shows a comparison of project completion dates established by a traditional CPM schedule (shown in grey) and a risk-adjusted CPM schedule (shown in gold).
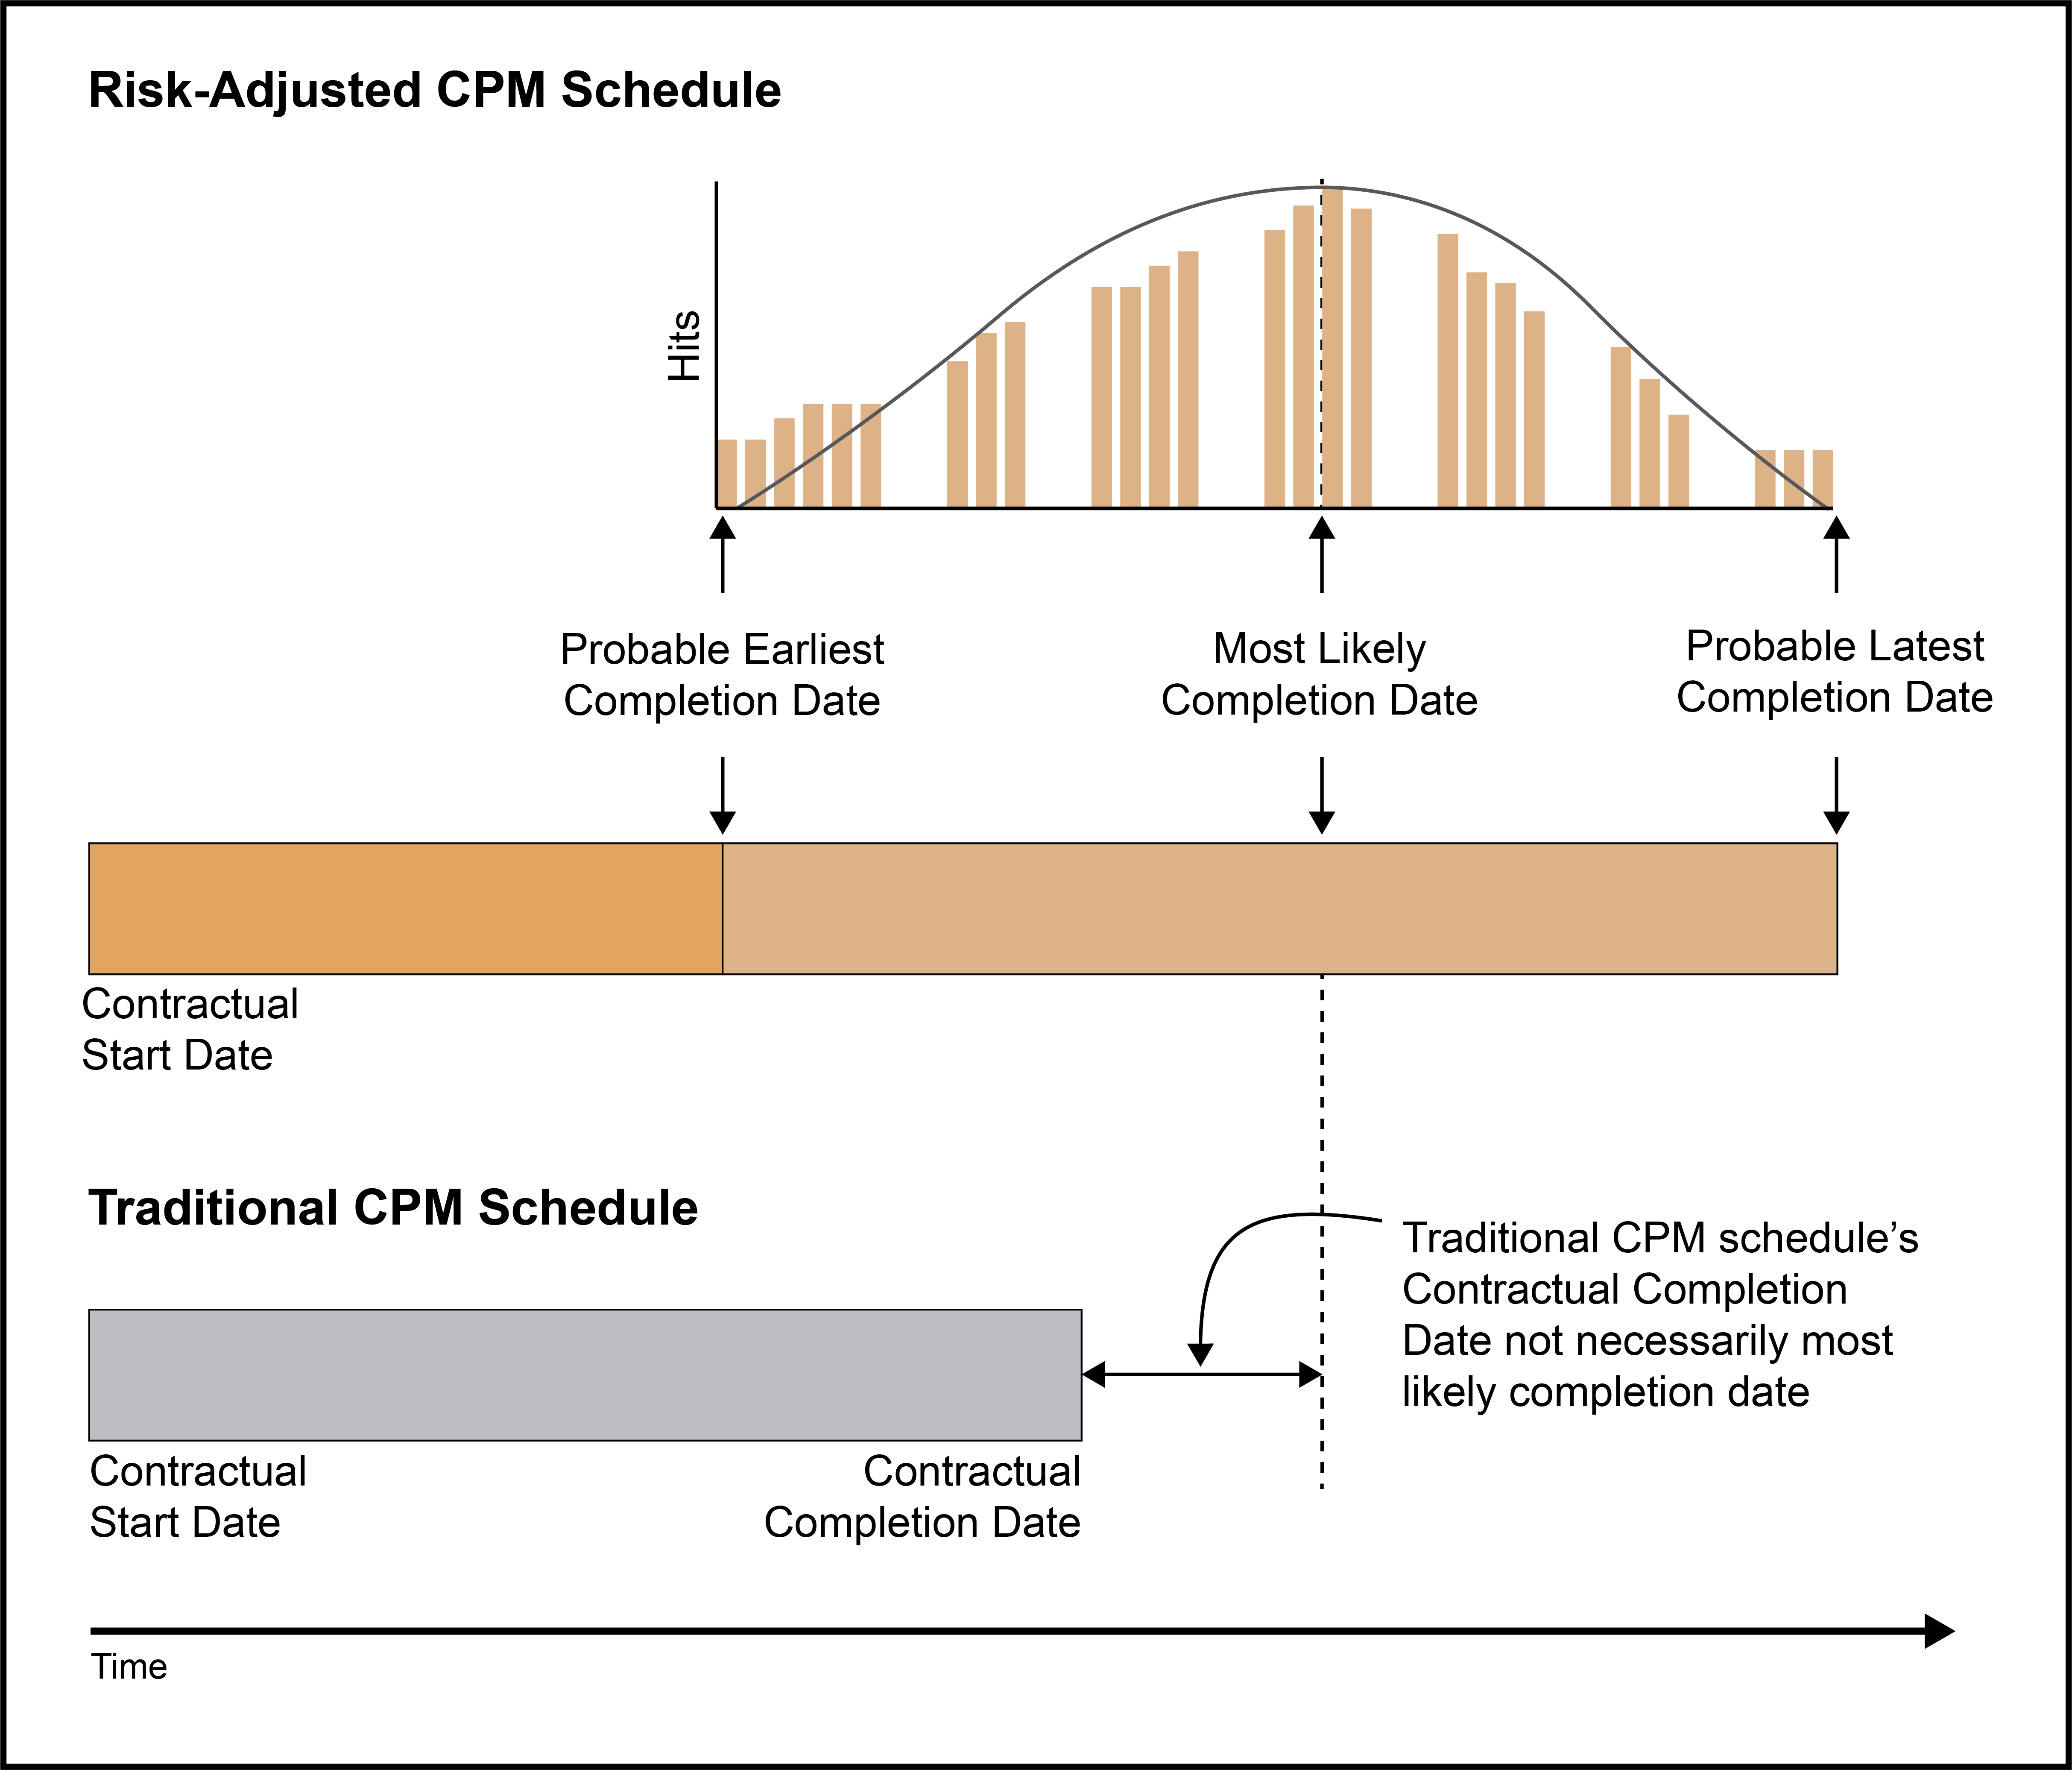
Figure 2 – Comparison of traditional CPM schedule and risk-adjusted CPM schedule in terms of completion dates
As shown, the contractual completion date determined by the traditional CPM schedule is not necessarily the most likely completion date based on the risk-adjusted CPM schedule. In fact, there is a range of probable completion dates determined by the risk-adjusted CPM schedule that can be taken into consideration.
Final Thoughts
Prior to the tender stage, owners may wish to consider using risk-adjusted CPM schedules in order to better understand the project risks and the influence they have on the specified contractual completion date. This may then assist owners in setting a more probable contractual completion date, or even a range of contractual completion dates, based on a certain desired level of confidence.
For their part, contractors may also wish to develop risk-adjusted CPM schedules to better understand the risks involved in achieving the specified contractual completion date and to use the information gained from such schedules to assist in estimating the required schedule contingency, and ultimately to more effectively manage their projects.
As discussed above, risk-adjusted CPM schedules provide an additional layer of insight into schedule uncertainty, allowing parties to make more informed decisions. This may be a means of reducing conflicts and claims between the parties in the case of delays on projects.
- KPMG International Cooperative, Global Construction Survey 2015 – Climbing the curve; 2015 Global Construction Project Owner’s Survey, 2015, https://assets.kpmg/content/dam/kpmg/pdf/2015/04/global-construction-survey-2015.pdf, accessed 2023-05-01.
-
S. Changali, A. Mohammad and M. van Nieuwland, The construction productivity imperative; How to build megaprojects better, McKinsey & Company, McKinsey Productivity Sciences Center (July 1, 2015), https://www.mckinsey.com/business-functions/operations/our-insights/the-construction-productivity-imperative, accessed 2023-05-01.
-
KPMG International, No turning back; An industry ready to transcend – 2021 Global Construction Survey, 2021, https://assets.kpmg.com/content/dam/kpmg/ie/pdf/2021/09/ie-global-construction-survey-2.pdf, accessed 2023-05-04.
-
Variations in activity duration can occur due to many factors, such as assumed productivity rates not being achieved, etc.
-
A detailed discussion on these indices is outside of the scope of this article.
-
Early and late.
-
This is performed using the Critical Path Method. Several different critical paths may be computed during each simulation and it is possible that the activities that are critical in the traditional CPM schedule may not be the same as those identified in the risk-adjusted schedule for the same project.
The Revay Report is published by Revay and Associates Limited, a Canadian firm specializing in construction claims management and dispute resolution services. We assist our clients by bringing clarity to complex issues. Contents may be reproduced with a credit as to source.
The principles presented in this article are those of the author and may not necessarily reflect the view of the company. The author recommends seeking legal advice before applying any principles outlined in this article.
Your comments and suggestions for future articles are most welcome.
Please advise the Montreal office of any change of address or recipient.
Subscribe to
The Revay Report.
You may withdraw your consent at any time by contacting bulletin@revay.com